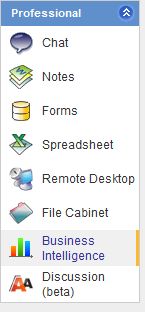
Business Intelligence allows you to create customized, graphical reports from selected files. Instead of having to export a spreadsheet into Excel to create charts you can now do all of it in one program. Business Intelligence also manages investments in people by allowing you to identify your under-achievers, over-achievers, resource bottlenecks, etc. This section steps you through Creating a Customized Report and Deleting a Customized Report.
1. Click the Business Intelligence icon.

2. Click New.
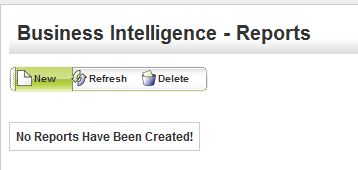
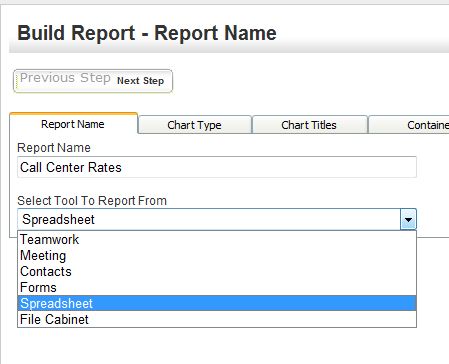
3. Enter a Report Name in the box provided.
4. Select the Tool that you want to pull the report data from the drop down menu.
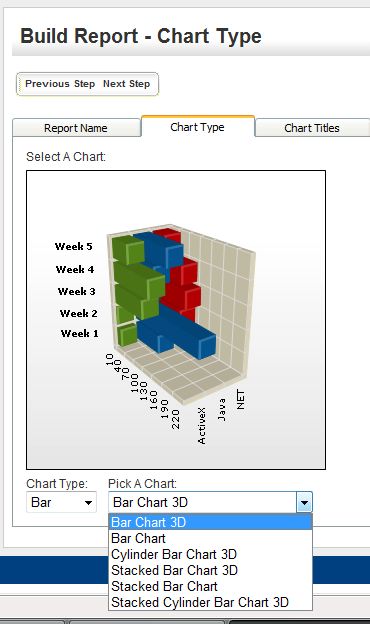
5. Select the Chart Type tab.
6. Choose the type of chart you want from the drop down menu at the bottom of the window.
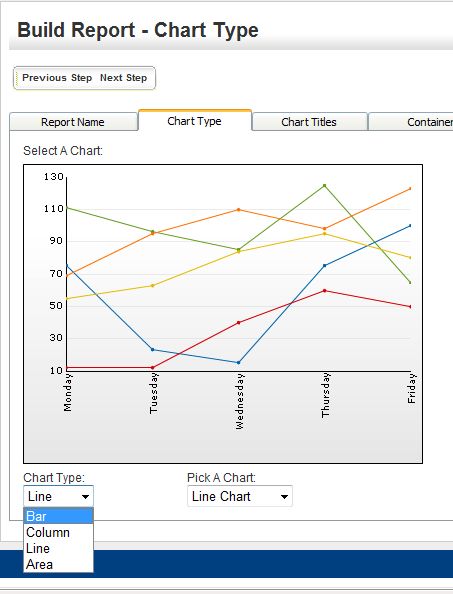
7. Select the Pick A Chart drop down menu to make your selection.
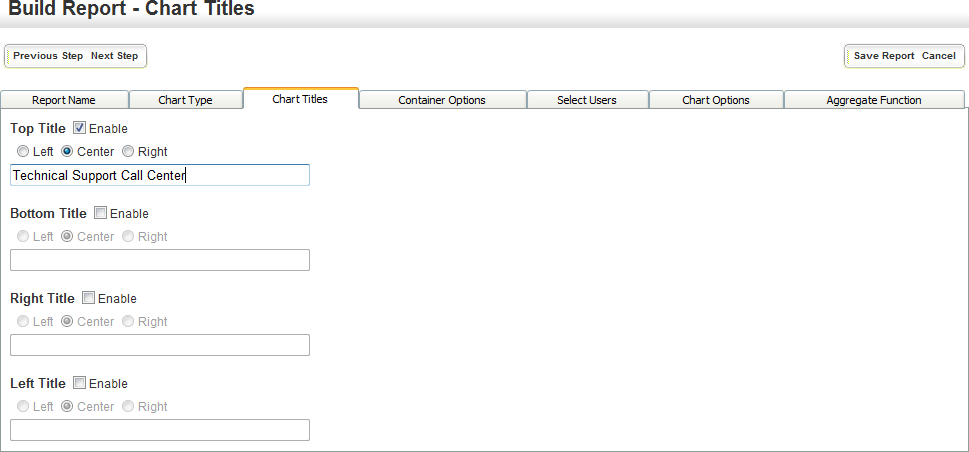
8. Click on the Chart Titles tab.
9. Select if you would like a title displayed on the chart by clicking the Enable box by the appropriate option. (Note: You can select form the title being at the top, bottom, right, or left.)
10. Select whether you would like the title to be centered to the left, center, or right.
11. Type a title in the window provided.
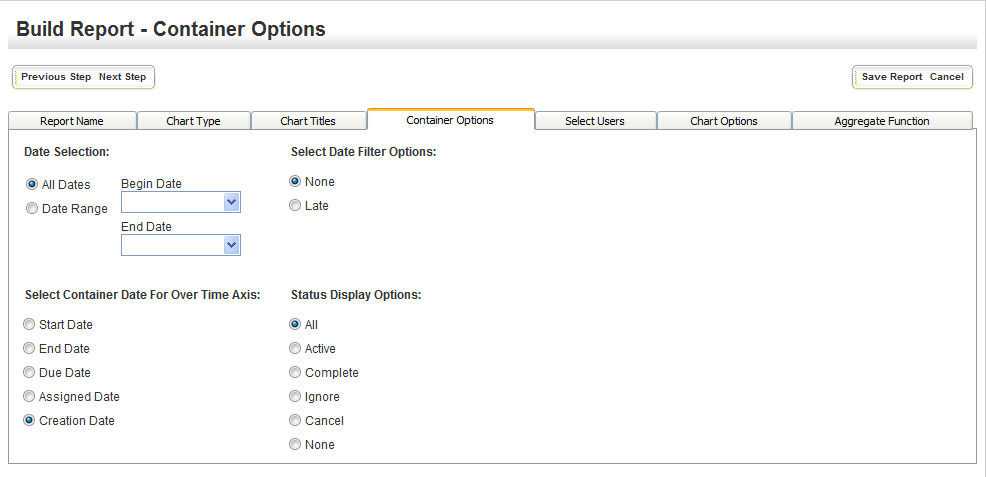
12. Choose the Container Options tab.
13. Select the Date or Date Range for the report.
14. Set the Data Filter Options for the Over Time Axis.
15. Click the radio button to choose the Status Display Options.
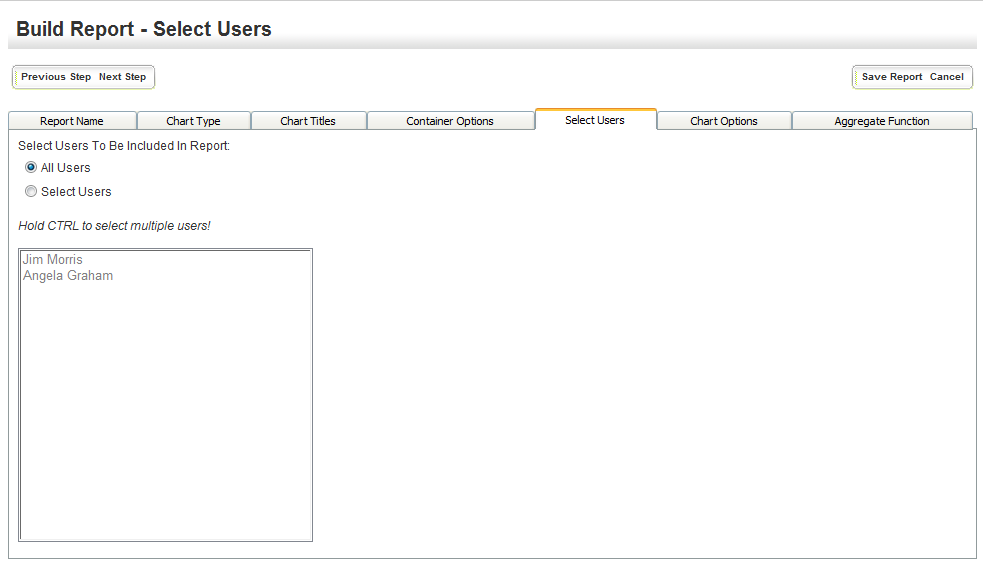
16. Choose the Select Users tab.
17. Select the All Users or choose specific users from the window, as shown below.
18. The next step is to select the Chart Options tab.
19. Place checkmarks in the appropriate boxes for the X-Axis and Y-Axis settings.
20. Choose if you would like a legend to appear and where you want it to appear on the chart.
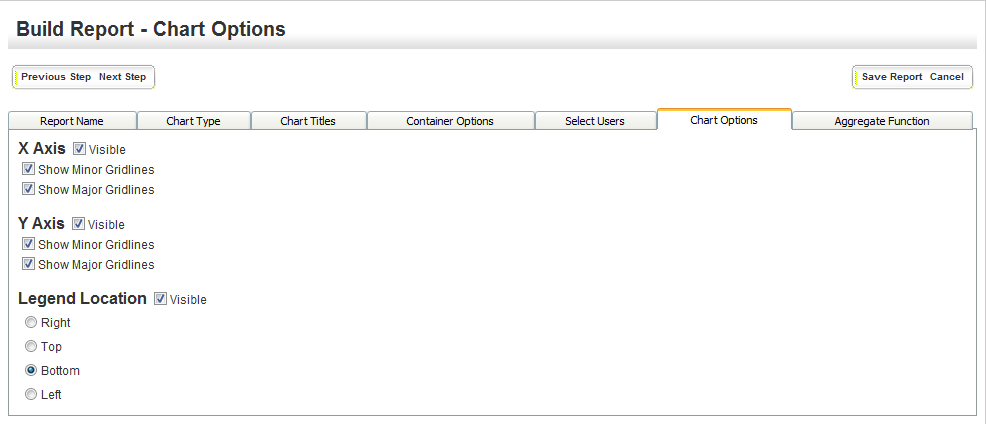
21. Select the Aggregate Function tab.
22. Choose the appropriate radio button for the Fact Table.

23. Choose the Save Report button.
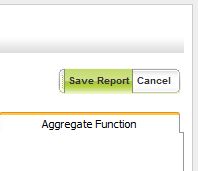
24. Click on the link to the newly created report.

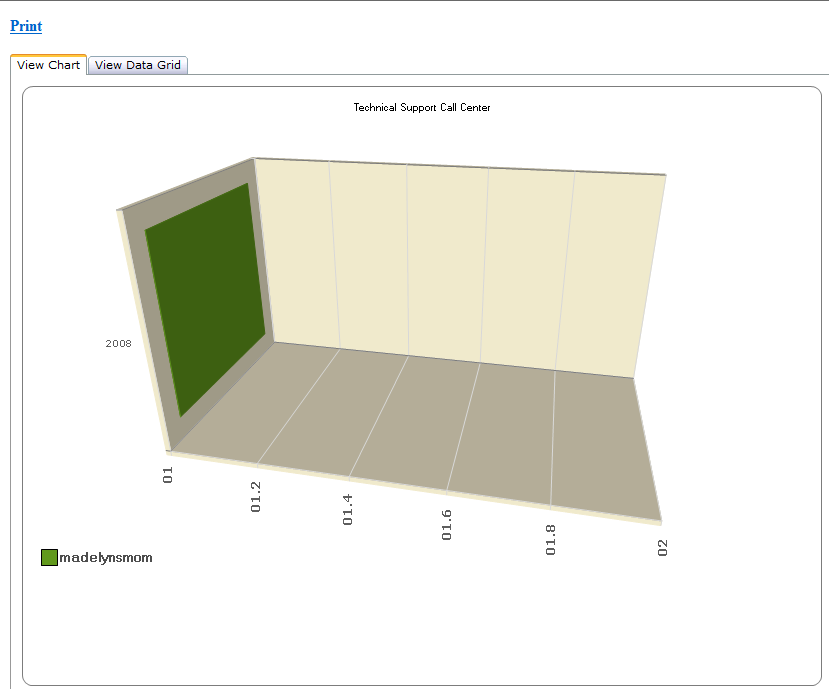
25. The View Chart tab should show the report, similar to the one shown below.
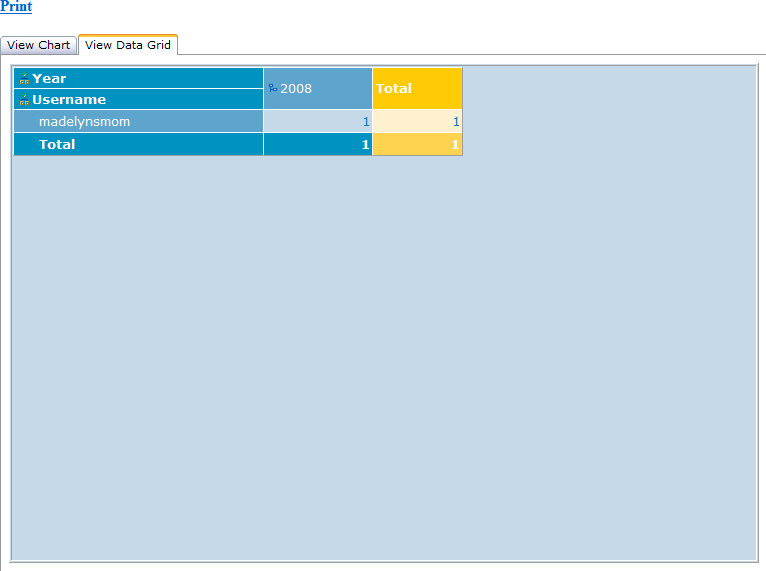
26. Choose View Data Grid to see the additional report.
1. Click the Business Intelligence icon.

2. Place a checkmark next to the report to delete.
3 .Click the Delete button.
